Charting Blog - Nov 21, 2021
- Nov 21, 2021
- 5 min read
I hope you all have a lovely weekend, and this is something for you to check after the lunch.
NINE charts and a bit of text - a few minutes read. Click on the charts to enlarge.
This Blog will cover:
1) Friday, Nov 19 2021 on German DAX
2) Large time frame charts of DAX, SPX, NDX and RUT
Everything shown here is from the Day-Trading perspective.
Difference between Day-Trading and Swing Trading:
1) Friday Recap
As a form of Trading journal, I am making the "Setups Gallery", where I mark and describe potential DAY-TRADING entries. Since every analyses SHOULD have Top-Down approach, let's start with the higher timeframes first.
Chart #1 - DAX CASH DAILY

From 43-point RTH range on Wednesday, to the 190-point RTH range on Friday.
From Contraction -> we get Expansion. Sooner or later. This is still a shallow pullback, when we look at the move from 14,800 - but more about it later.
Let's go down and review what were the KEY POINTS of Friday
Chart #2 - CFD Zones Chart on 15 min
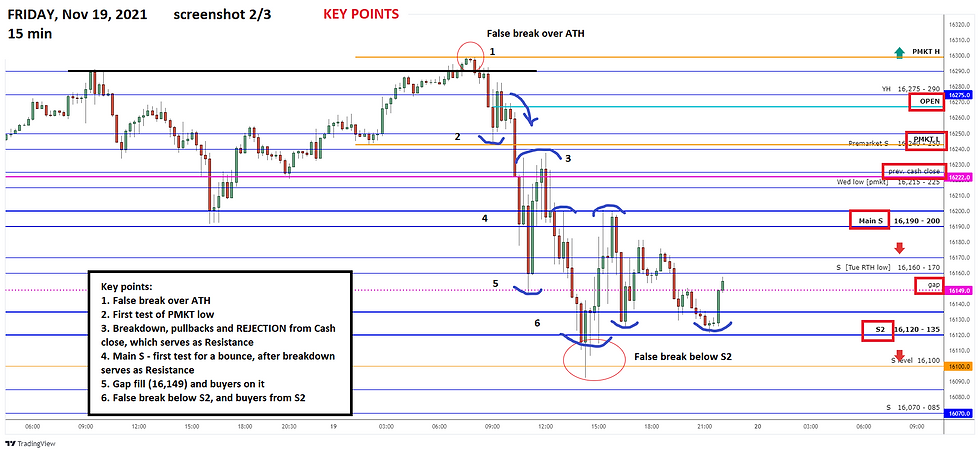
HOD (High of Day) as a false break over ATH level, LOD (Low of Day) as a false break of S2 zone. Here, and on the following two small time frame charts, you can observe how S1 (Main Support) zone was acting as AXIS - providing Support first, and Resistance later.
Let's go even lower, on a 3-min chart.
Chart #3 - Zones chart with marked and described Entry points on 3 min

During the Session, we had MANY tests of various inflection points, many scalping opportunities. Sudden increase in volatility is not for everybody, and many traders lost in the "let me try this" trades and trading with "tight" stops.
As always. better zones are the ones with thick lines, where FADES should have better chances of success. Example: In the Chart #2, you can observe that below S2 zone - there were ONLY TAILS below it, and that every entry with the resting order in the middle of the zone was actually good, IF taken with at least 35 pts stop (40-50 would be better). Proven Setups are marked with the RED COLOR on the above screenshot.
What COULD happen, if market BREAKS your very important level / zone AND you took a loser? 1) It was a false break. Upon confirmation, enter AGAIN. 2) It was a real break, and you can get the trade in opposite direction, as a BREAKOUT trade OR as B-P-C (break-pullback-continuation) trade.
Did we had, besides OpEx and scheduled news, any other news driven influence on Friday?
And the answer is YES. That is marked in the next chart, this time on Futures.
Chart #4 - FUTURES on 5 min

Austrian Chancellor had a press conference at 10:15 am CET, about Covid and total lockdown, and there were also news about "Germany Covid crisis getting out of control".
Breakdown below Premarket low started at 10:25 am CET.
Question: Were there technical reasons for the drop?
Answer: YES.
Market was grinding higher, on absence of momentum and with bearish divergence FOR DAYS - check my Tweeter feed about it - AND we had a classic bearish setup as false break over ATH right at the open.
IF the Intraday bias is Neutral-Bullish ABOVE the Premarket low, what happens THEN, when market after the first bounce makes a breakdown below this inflection point? Bias change to NEUTRAL at first, and then below Main Support into the Neutral-Bearish (Sell the Rip).
Now let's go back to the DAILY CHART, and take another look at the Chart #1 and the marked RED rectangles below. Those are IMO logical TARGETS, IF we get some downside continuation. When trading indices - do your LTF charts ALWAYS on Cash Index or Futures, and best would be ON BOTH. Next chart is FDAX Daily.
2) LTF CHARTS
Chart #5 - FDAX DAILY

Combine this chart, with the first one from this blog, Chart #1 - DAX CASH INDEX DAILY.
On Cash Index, there are several unfilled gaps between 15,700 and 15,800; AND in the same time, there lies the 38.2 Fibonacci retracement of the entire move from Oct 6th.
Market made a 1,500 points move, so 500 points pullback would be quite normal to see. Will it happen though? I don't know, all I know that that would be NORMAL TO SEE. But first, price need to break below 16k area, which is important Support on Daily charts.
Finally - the biggest picture of all that I personally have - MONTHLY CHART.
Chart #6 - FDAX MONTHLY

November is still not over, 7 trading days to go, but let's quickly observe this chart as well, and the 14-year old channel. Many months price was grinding on the top rail of it.
CONCLUSION for DAX
Move to the 16k for start should be in the books, and THEN, based on reaction there, can continue to fill the gaps in the 15,700-800 area, where BUYERS are expected to react.
SEASONALITY played well for all markets, with September bearish and October bullish, now entering into another seasonally bullish period, so BUYERS expected on such good dips.
IF market shows strength, pullbacks will be shallow, and now the new ATH is the Resistance (Thu/Fri highs), which bulls need to break, to reach the Trendline resistance, which is currently around 16,380 on Futures.
"Market awareness" kicking in now, with charts of US indices.
DAX didn't had a pullback, while SPX and NDX had, so let's compare these indices.
Starting with the "mother of all", mighty SPX.
Chart #7 - SPX CASH DAILY

No new ATHs for SPX, a mere 1.8% pullback made, and Supports marked - the ones that bears need to break to initiate a potentially bigger one.
Chart #8 - NDX CASH DAILY

The "HOLD MY BEER" Nasdaq 100 - made a new ATH on Friday - with the gap up, and is the only one that closed green on Friday.
But before that, it also made 3+ percent pullback, which would be like a 500+ points on DAX. Inline with the 15,700-800 target. Now, DAX is not correlating with Nasdaq, this is for illustrating purposes, to understand what 3% pullback actually means IN POINTS.
Finally, the "wild card" - Russell 2000, the Small Caps Index.
Chart #9 - RUT DAILY

Think about ACCEPTANCE and REJECTION here. This chart could be very important for SPX and NDX as well, since if RUT continues down, it will be hard for others to just push higher.
CONCLUSION FOR US markets
What Bull camp need to see: SPX breaking to new ATHs, NDX with continuation, RUT catching the bid and moving out from the previous consolidation (REJECTION from it)
What Bears need to see: SPX losing first Support, NDX making a Bull-Trap out of Friday, RUT going down, and being ACCEPTED BACK into the previous range.
Scenarios are made not to have one that will be "right", and run victory laps after, but to be ready for the price action that market will throw in front of you. So, once again, not to be right or wrong, but to be ready. Money will not be made by guessing the direction, but by monetizing setups. Be sure you understand risk BEFORE entering a trade, and apply proper stops (behind invalidation point).
If you like this - consider to like / retweet the announcement tweet or this Blog.
Last Blog - LINK HERE - was read by 400+ traders. This is done for you.
Cheers, Relja a.k.a. StrayDog


Comments