DAX and SPX Weekly Analyses, Jan 5, 2020
- Jan 5, 2020
- 4 min read
Strong 2019 for both indices. In fact so strong, that now the question is what catalysts are needed to continue such a run, OR we could get the similar thing like with 2017 and 2018.
Mini RANT
Many will say how Dow was once 1,000 and now it is close to 30,000. That is true, but IMO a totally useless fact. Buy and hold is great IF YOU GOT THE TIMING RIGHT. I am sure that buyers of the 2007 and 2008 tops, the ones that INITIATED positions in this years, were not waiting for spring of 2013 to get to breakeven. But since majority of traders didn't even trade in those years, let me give you some recent examples. Like Oct 2014 - Nov 2016 trading range on SPX. A TWO YEARS trading range. So timing is very, very important there, unless you are COMMITTED to hold your entire life.
How SPX squeezes sellers once above the previous ATH is explained in this short 3 minute video.
From Dec 4, and that backtest of the upsloping trendline that EVERYBODY had on their charts, SPX bounced ~190 points. Simple backtest of upsloping trend line in bullish environment.
Markets are news driven, and all eyes are going to be on geopolitics and risks there, with US and Iran relationship. US-China trade deal is next by importance. Next week calendar: US ISM Non-Manufacturing PMI on Tuesday, ADP Non-Farm Employment Change on Wednesday, Chinese CPI y/y on Thursday, NFP report on Friday.
Chart #1 - Oil - CL_F Daily

Good run up on Oil, and pushed with the news directly into resistance. This is an example of good location to fade that move. Resistance that was not tested for 3.5 months, and exhaustion move into it. No edge in buying Oil at $64 was there. That resistance need to be broken, to act as support, for you to buy at this prices. Something to observe in gauging how serious this possible conflict between US and Iran can be. So far, rhetorics is harsh, and SPX is high enough for players to "remove some chips from the table". Serious conflict would push Oil higher, VIX higher, Stock market down.
Chart #2 - SPX Cash Daily

New ATH made in Overnight session, gap up and go on "China talks going fine" news, and next day gap down on US-Iran news. Market IS stretched to the upside. Current prices are far from attractive, to INITIATE a long position (timing again), and for INITIATING a short swing position, I would prefer to see some evidence of weakness and supports breakdowns first. Unfilled gaps are stacking behind in large numbers... something to "carry forward".
Chart #3 - DAX and SPX previous bearish divergences on large timeframes
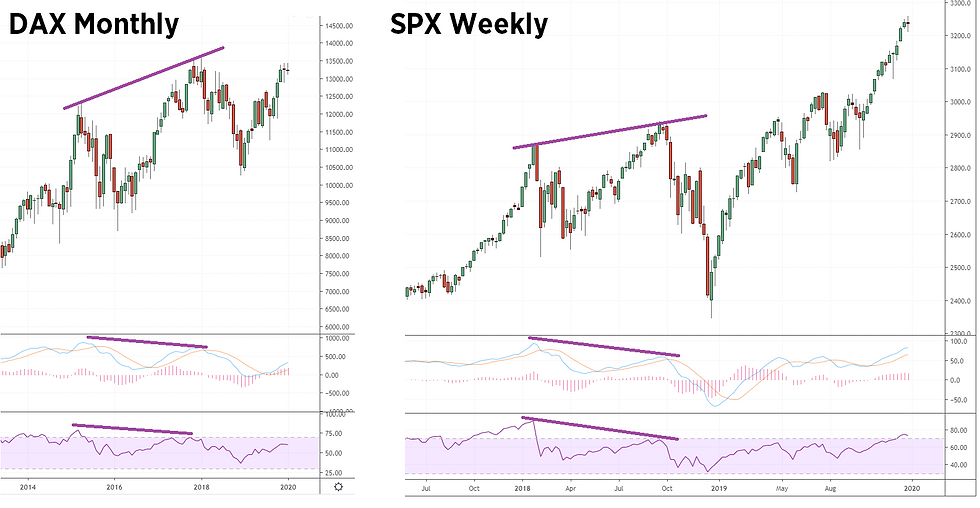
Bearish divergence WAS quite visible on DAX ATH. Also on previous ATH on SPX, from Oct 2018. Now we don't have such divergence.
More LTF charts: Check ASX 200 here, in this tweet.
Chart #4 - ES_F 240 min chart

From rising wedge and minimal pullback (just to fill one of the cash index gaps) to megaphone. Top and bottom of this pattern are first inflection points. ATH and Friday low.
Chart #5 - RUT Daily (the wild card)

Still far away from ATH level, RUT is the wild card. Currently inside upsloping trading chanell. Oil, RUT, NDX, VIX, Gold - additional markets to watch when making decisions in swing and position trading SPX. For example, weak RUT can't help SPX to go higher. Gold chart from @TraderSimon HERE.
Chart #6 - DAX Cash Index Monthly

Advance higher stopped in December, with ATH very close. High of 2019 was made in premarket, and also tested in the premarket on Friday, Jan 3rd. Markets are prone to retest such swing highs or lows.
Chart #7 - DAX Cash Index Daily

Unlike SPX, DAX made a lengthy megaphone pattern, or Broadening Formation.
Former trading range have morphed into a megaphone. Now we have another range, from 13,100 to 13,460 like I showed in this tweet on Friday.
Those are our inflection points for next week.
Conclusion: US markets are very strong. Stretched, but for selling we need to see evidence of weakness, and to be AWARE where are better supports - clearly visible on the above charts. Buying SPX this high, INITIATING a position now - is IMO risky. Buyers need to wait for the pullback. Sellers better wait for evidence of weakness. This ramp up is very similar to the one on January 2018. For day-trading, we need to be aware of large time frame S/R levels and to determine good levels and zones on lower timeframes and trade those, always with the context and knowing which side is dominant and where the risk is smaller. That goes for DAX also, or any other instrument.
Squeezing sellers once more before the bigger drop is always one of the scenarios. Indication of this is that after the overnight drop on ES_F, buyers were active from the open on Friday. We can also look at the weekend indication on trading platforms - to see IF there could be some gaps. The start of futures session on Monday will give us some clues for RISK OFF or RISK ON environment.
Friday lows on indices and can markets HOLD above them or not - that will be a valuable information for us, to begin the next week.
In short term trading it is very important to properly understand context heading into every day, to know from which side wind is blowing - who has the short term control, and which side will be forced to liquidate IF and WHEN market hold above or below a certain level. What is the level of volatility, what can we expect from any particular day, what market already done in premarket session, what possible setups can be available, and so on... the things that we constantly learn in the DAILY DOSE OF DAX.
Cheers, StrayDog


Comments